Inside BarsMark Inside Bars with a triangle above the calendar. This indicator supports having different colors and alerts for 1, 2 or 3 consecutive inside bars.
Cari dalam skrip untuk "inside bar"


Inside Bar Momentum Alerts v1Alerts for Inside Bar Momentum Strategy
Purple Diamonds show IBs
triangles at top show long alerts
triangles at bot show short alerts


Inside Bars - Rob Dee editCatch Inside Bars with ease with this tool.
Adjust the colour and intensity of the indication candle.


Simultaneous INSIDE Bar Break IndicatorSimultaneous Inside Bar Break Indicator (SIBBI) for The Strat Community
Overview:
The Simultaneous Inside Bar Break Indicator (SIBBI) is designed to help traders using The Strat methodology identify one of the most powerful breakout patterns: the Simultaneous Inside Bar Break across multiple symbols. This indicator detects when all four user-selected symbols form inside bars on the previous candle and then break those inside bars in the same direction (either bullish or bearish) on the current candle.
Inside bars represent consolidation periods where price action does not break the high or low of the previous candle. When a simultaneous break occurs across multiple symbols, this often signals a strong move in the market, making this a key actionable signal in The Strat trading strategy.
Key Features:
Multi-Symbol Analysis: You can track up to four different symbols simultaneously. By default, the indicator comes with SPY, QQQ, IWM, and DIA, but you can modify these to track any other assets or symbols.
Inside Bar Detection: The indicator checks whether all four symbols have inside bars on the previous candle. It only triggers when all symbols meet this condition, making it a highly specific and reliable signal.
Simultaneous Break Detection: Once all symbols have inside bars, the indicator waits for a breakout in the same direction across all four symbols. A simultaneous bullish break (prices breaking above the previous candle’s high) triggers a green label, while a simultaneous bearish break (prices breaking below the previous candle’s low) triggers a red label.
Dynamic Label Timeframe: The indicator dynamically adjusts the timeframe in the label based on the user’s selected timeframe. This allows traders to know precisely which timeframe the break is occurring on. If the user selects "Chart Timeframe," the indicator will evolve with the current chart's timeframe, making it more versatile.
Timeframe Flexibility: The indicator can be set to analyze any timeframe—15-minute, 30-minute, 60-minute, daily, weekly, and so on. It only works for the specific timeframe you set it to in the settings. If set to "Chart Timeframe," the label will adapt dynamically based on the timeframe you are currently viewing.
Customizable Labels: The user can choose the size of the labels (tiny, small, or normal), ensuring that the visual output is tailored to individual preferences and chart layouts.
Best Use Case:
The Simultaneous Inside Bar Break Indicator is particularly powerful when applied to multiple timeframes. Here’s how to use it for maximum impact:
Multi-Timeframe Setup: Set the indicator on various timeframes (e.g., 15-minute, 30-minute, 60-minute, and daily) across multiple charts. This allows you to monitor different timeframes and identify when lower timeframe breaks trigger potential moves on higher timeframes.
Anticipating Strong Moves: When a simultaneous inside bar break occurs on one timeframe (e.g., 30-minute), keep an eye on the higher timeframes (e.g., 60-minute or daily) to see if those timeframes also break. This stacking of inside bar breaks can signal powerful market moves.
Higher Conviction Signals: The indicator is designed to provide high-conviction signals. Since it requires all four symbols to break in the same direction simultaneously, it reduces false signals and focuses on higher probability setups, which is crucial for traders using The Strat to time their trades effectively.
How the Indicator Works:
Inside Bar Formation: The indicator first checks that all four selected symbols had inside bars in the previous bar (i.e., the current high and low are contained within the previous bar’s high and low).
Simultaneous Break Detection: After detecting inside bars, the indicator checks if all four symbols break out in the same direction—bullish (breaking above the previous bar’s high) or bearish (breaking below the previous bar’s low).
Label Display: When a simultaneous inside bar break occurs, a label is plotted on the chart—either green for a bullish break (below the candle) or red for a bearish break (above the candle). The label will display the timeframe you set in the settings (e.g., "IBSB 60" for a 60-minute break).
Chart Timeframe Option: If you prefer, you can set the indicator to evolve with the chart’s current timeframe. In this mode, the label will not show a specific timeframe but will still display the simultaneous inside bar break when it occurs.
Recommendations for Usage:
Focus on Multiple Timeframes: The Strat methodology is all about understanding the relationship between different timeframes. Use this indicator on multiple timeframes to get a better picture of potential moves.
Pair with Other Strat Techniques: This indicator is most powerful when combined with other Strat tools, such as broadening formations, timeframe continuity, and actionable signals (e.g., 2-2 reversals). The simultaneous inside bar break can help confirm or invalidate other signals.
Customize Symbols and Timeframes: Although the default symbols are SPY, QQQ, IWM, and DIA, feel free to replace them with symbols more relevant to your trading. This indicator works well across equities, indices, futures, and forex pairs.
How to Set It Up:
Select Symbols: Choose four symbols that you want to track. These can be index ETFs (like SPY and QQQ), individual stocks, or any other tradable instruments.
Set Timeframe: In the indicator’s settings, choose a specific timeframe (e.g., 15-minute, 30-minute, daily). The label will reflect the selected timeframe, making it clear which time-based break you are seeing.
Optional - Chart Timeframe Mode: If you want the indicator to adapt to the chart’s current timeframe, select the "Chart Timeframe" option in the settings. The indicator will plot the breaks without showing a specific timeframe in the label.
Customize Label Size: Depending on your chart layout and personal preference, you can adjust the size of the labels (tiny, small, or normal) in the settings.
Conclusion:
The Simultaneous Inside Bar Break Indicator is a powerful tool for traders using The Strat methodology, offering a highly specific and reliable signal that can indicate potential large market moves. By monitoring multiple symbols and timeframes, you can gain deeper insight into the market's behavior and act with greater confidence. This indicator is ideal for traders looking to catch high-conviction moves and align their trades with broader market continuity.
Note: The indicator works best when paired with multi-timeframe analysis, allowing you to see how breaks on lower timeframes might influence larger trends. For traders who prefer simplicity, setting it to the "Chart Timeframe" mode offers flexibility while maintaining the core benefits of this indicator.

Double Inside bar // Consecutive Inside Bar = Ak47Double Inside Bar Indicator Or Consecutive Inside Bar Highlighting
This custom Pine Script indicator is crafted for traders who utilize the traditional Inside Bar . A Double Inside Bar is a more specific pattern, involving two consecutive bars that are both contained within the range of a preceding "mother bar". This script not only detects these patterns but also emphasizes consecutive occurrences with a distinctive visual marker, aiding traders in identifying these setups amidst market fluctuations.
Features:
Double Inside Bar Detection: Identifies Double Inside Bars, where two successive bars are completely contained within the range of the preceding bar. This pattern indicates potential continuation or reversal with a stronger conviction.
Consecutive Pattern Highlighting: Highlights consecutive Double Inside Bar patterns, offering a clear visual indication for traders. This feature can be enabled or disabled as per the user's preference.
Bullish and Bearish Color Coding: Differentiates bullish and bearish setups by coloring the bars green or red, respectively, providing immediate insights into market sentiment.
Unique Visual Markers: Utilizes shapes to indicate bullish (triangle up) and bearish (triangle down) Double Inside Bars. For consecutive patterns, irrespective of being bullish or bearish, a yellow diamond is displayed below the bar to focus on the pattern's potential for signaling substantial market moves.
Trading Strategy:
Buy Signal: When a Double Inside Bar pattern is detected, a buy signal is generated. The entry point for the trade is set just above the high of the mother bar, with a stop loss placed just below the low of the mother bar, aiming to capture upward breakouts effectively.
Sell Signal: A sell signal is indicated by the detection of a Double Inside Bar pattern. The trade entry is positioned just below the low of the mother bar, with a stop loss above the high of the mother bar, targeting potential downward breakouts.
Why Use This Indicator?
Enhanced Decision Making: By providing clear visual cues for Double Inside Bar patterns and especially emphasizing consecutive occurrences, traders can make more informed and confident decisions.
Adaptability: The ability to toggle the highlighting for consecutive patterns allows traders to customize the indicator to match their trading style and the prevailing market conditions.
Simplicity and Effectiveness: This indicator streamlines the detection of significant Double Inside Bar patterns, helping traders to focus on their strategy and manage their time more efficiently.
Conclusion
This Double Inside Bar Indicator is a vital tool for traders looking to leverage the predictive power of Double Inside Bar patterns. With its unique consecutive highlighting feature and intuitive color coding, it enhances trading strategies by pinpointing potential breakout opportunities with higher precision.

2 Bar Master Pattern Indicator ( MTF Inside Bars ) THE 2 BAR MASTER PATTERN IS A PRICE ACTION INDICATOR
It is based off of the master pattern concepts which explains the market moving through a 3 phase cycle.
Phase 1 - Contraction
Phase 2 - Expansion
Phase 3 - Trending
THESE 3 PHASES ARE HAPPENING ON EVERY TIME FRAME AND ON EVERY ASSET CLASS.
The first phase of the cycle is the contraction phase, this is where price goes
into contraction which is measure by a simultaneous lower high / higher low.
The contraction phase can be measured with many forms of contraction methods, such as 2 bar / 3 bar and multi bar contraction detection.
The 2 bar master pattern detects inside bars, based off 2 bar candle detection, when detected it will color the candle and a value line will project out of the center.
When it identifies an inside bar it will bring a line through the centre of the inside bar which is known as a value line, these are key levels that price can either find support or resistance on these levels, or a level when broken price can breakout and take off.
MTF FUNCTIONALITY
We have coded into the logic a Multi Time Frame function so that you can have it identify any inside bar on any time frame. 2 bar inside bars work best on higher time frames such as the 4hr and above therefore with the multi time frame functionality you can set it to a higher time frame of choice and be on a lower chart timeframe where you will take your entries off of.
SHORT ENTRY EXAMPLE
LONG ENTRY EXAMPLE
In the example above its set to the weekly chart as the time frame to detect the 2 bar master patterns, and the timeframe for entry is the 4hr time frame, this will change depending on your trading style and timeframes you like to trade on.
2 BAR MASTER PATTERNS CAN BE USED FOR REVERSALS AND CONTINUATION TRADING.
CONTINUATION INSIDE BAR TRADING
When you have a inside bar formed on a higher time frame, you mark the high and low of the inside bar, and depending on the direction of the trend - if on a up trend and it breaks the high of the inside bar is an long entry - and if its on a downtrend and the low of the inside bar is broken thats the set up for a short entry.
REVERSAL INSIDE BAR TRADING
When you have an inside bar forming at the bottom or top of a range or key level, this can be a sign of weakness and a potential area where price will reverse in the opposite direction.
2 BAR MASTER PATTERN INSIDE BARS EITHER SHOW STRENGHTH OR WEAKNESS OF A TREND
If combined in combination with the higher time frame trend direction and the master patten concepts principles, you can find amazing entries.
Best place to look for long entries on a confirmed uptrend is when price is under the value lines
Best place to look for short entries on a confirmed downtrend is when price is above the value lines
Once you understand that the market is moving in this 3 phase cycle and become adept and identifying the 1st phase which is the contraction phase, it can open the door to a new way of percieving the market and making sense of the seemingly randomness of how it moves.

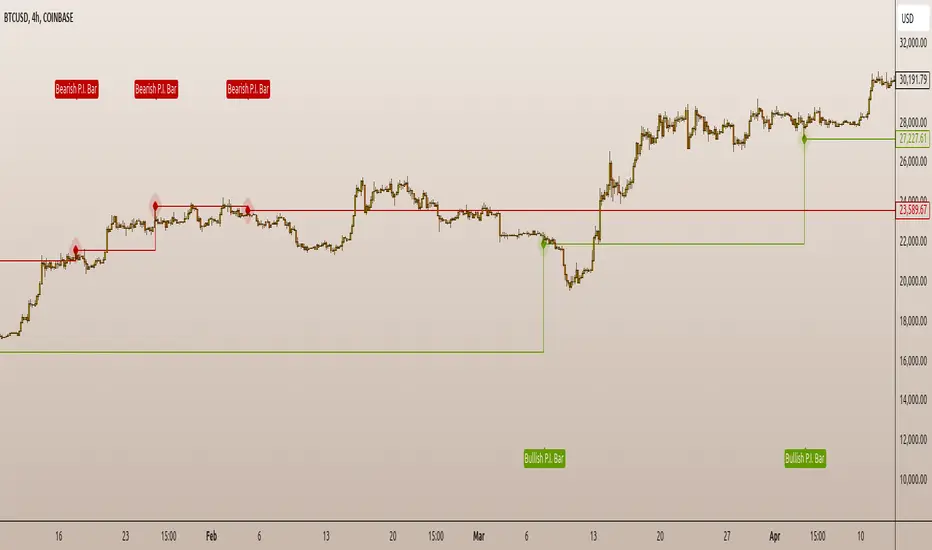
P.I.B. System (Pin Bar | Inside Bar) // AlgoFyreThe "P.I.B. System (Pin Bar | Inside Bar)" identifies bullish and bearish pin bars and inside bars on a price chart. It highlights potential market reversals by plotting labels and colorizing bars, providing traders with visual cues for better decision-making.
Description
The "P.I.B. System (Pin Bar | Inside Bar)" script is designed to help traders identify potential reversal points in the market by detecting bullish and bearish pin bars and inside bars. A pin bar is a candlestick pattern that indicates a potential reversal, characterized by a small body and a long wick. Inside bars are candlestick patterns where the current bar's high and low are within the previous bar's range, indicating potential consolidation before a breakout.
This script allows customization of various parameters to fine-tune the identification of pin bars and inside bars. When a pin bar or an inside bar is detected, the script plots a label on the chart and colorizes the bars to highlight these patterns. This tool is useful for traders looking to identify potential reversal points and make informed trading decisions.
Explanation of All Options
Pin-Wick Size Ratio Minimum Value : The minimum ratio of the wick size to the total candle size for a pin bar to be considered valid. Default is 0.66.
Candle Body Size Ratio Maximum Value : The maximum ratio of the body size to the total candle size for a pin bar to be considered valid. Default is 0.4.
Handle-Wick Wick Size Ratio Maximum Value : The maximum ratio of the opposite wick size to the total candle size for a pin bar to be considered valid. Default is 0.4.
Filter Out Small Candles : Option to filter out small candles based on the previous candle's size. Default is true.
Small Candle Size Ratio : The ratio used to determine if a candle is considered small compared to the previous candle. Default is 2.0.
Identify Inside Bars : Option to identify inside bars following a pin bar. Default is true.
Show Only P.I.B. : Option to show only the bars where a pin bar is followed by an inside bar. Default is true.
Hide Horizontal Rays : Option to hide horizontal rays drawn from the last identified pin bars. Default is false.
How to Use
To use this script, add it to your chart. Customize the input parameters to match your trading strategy. The script will automatically identify and highlight bullish and bearish pin bars and inside bars on the chart. Use the visual cues provided by the labels and colorized bars to make informed trading decisions.
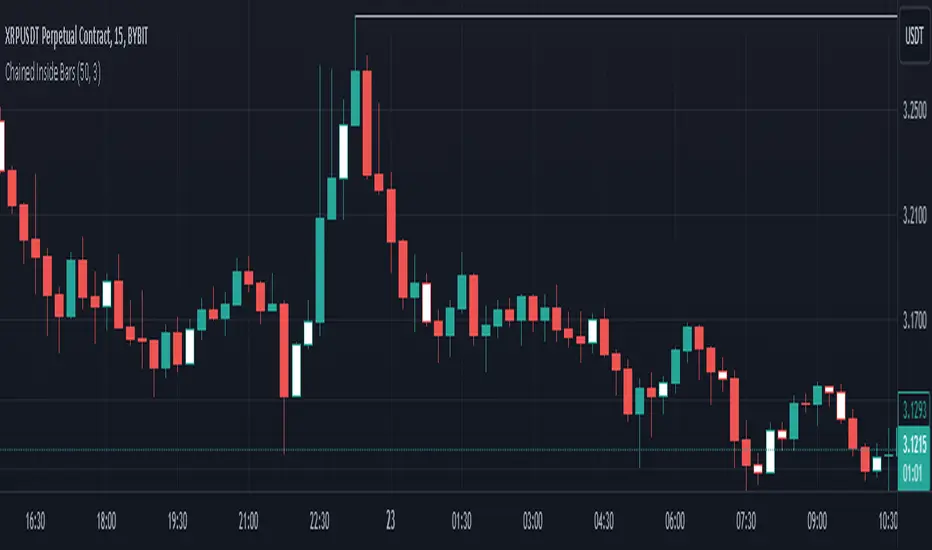
Chained Inside BarsThis script identifies consecutive inside bars by referencing only the most recent non-inside bar, so it avoids excessive lookback. An “inside” bar means its high is lower than the reference bar’s high, and its low is higher than the reference bar’s low. If the current bar is inside, it’s colored white; once price breaks outside, the script updates that new bar as the next reference.
Key Points
• Bars are compared against the last non-inside bar, chaining consecutive inside bars off that same reference bar.
• Inside bars are highlighted in white (non-inside bars retain default chart colors).
• Includes an alert condition for when a new inside bar forms.
• Prevents large dynamic indexing, making it more stable and efficient.
Use this indicator to quickly spot consecutive inside-bar formations without needing to track every single bar-to-bar relationship.
IL - Inside Bar Detector - v01Indicator: IL - Inside Bar Detector - v01
Product: An Indigo Lynx Indicator
Copyright: © Indigo Lynx, v01, 2025-07-04
Description:
This indicator identifies Inside Bar candlestick patterns, which can signal
consolidation or indecision in the market, often preceding breakouts.
It offers multiple definitions for what constitutes an Inside Bar, an
optional volume filter, and differentiates markers and display for
bullish or bearish closing inside bars.
Features:
- Detects Inside Bar patterns.
- Configurable Inside Bar Definitions (via "Inside Bar Definition" input):
1. "Body (O/C)": Current O/C body within previous O/C body.
2. "Range (H/L - Standard)": Current H/L within previous H/L.
3. "Super (Range & Body)": Requires BOTH conditions.
- Optional Volume Filter: Inside Bar volume < SMA of volume.
- Display Toggles: Separate options to show/hide Bullish closing IBs
and Bearish closing IBs.
- Customizable Visuals: Bar color and optional plotshape markers (differentiated
for bullish/bearish closing inside bars using "BI" and "BRI" text).
- Data Logging: Option to log detected pattern details.
How to Use & Interpret:
- Configure definition, volume filter, and display options.
- Inside Bars are highlighted by bar color if their type (bullish/bearish closing) is enabled.
- Optional shapes: Green up-triangle (BI) for bullish-closing Inside Bars,
Red down-triangle (BRI) for bearish-closing Inside Bars, if enabled.
- Use with other analysis methods for confirmation.
Disclaimer: Trading involves substantial risk of loss and is not suitable for all investors.
Past performance is not indicative of future results.

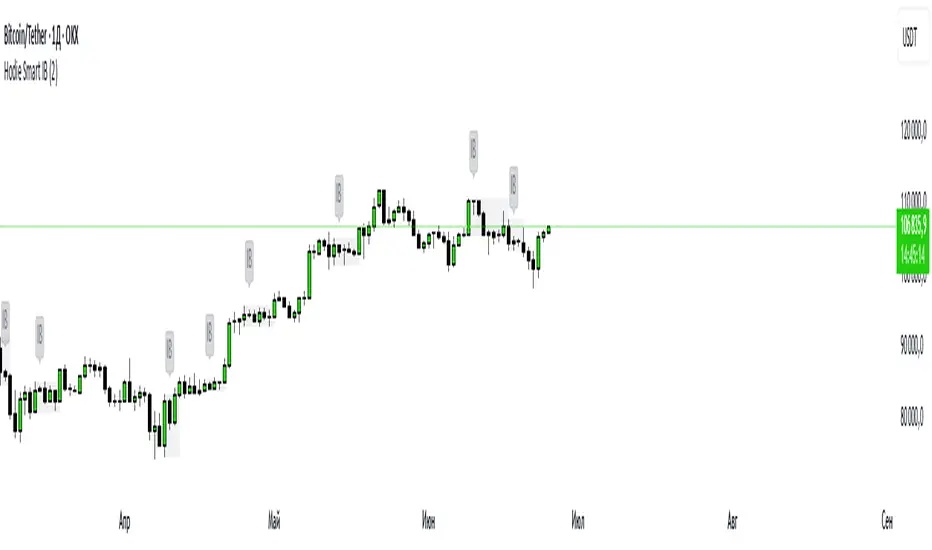
Hodie Smart Inside BarThe Hodie Smart Inside Bar indicator automatically detects and visually highlights inside bars — candles fully contained within the range of the previous (parent) candle.
How the indicator works:
Inside Bar Identification:
The indicator analyzes each candle and checks if its high is lower than the previous candle’s high, and its low is higher than the previous candle’s low. If this condition is met, the candle is considered an inside bar.
Size Filtering:
To filter out small and insignificant consolidations, the indicator compares the size of the parent candle’s range to the inside bar’s range. Only if the parent candle is significantly larger (2 times or more — adjustable parameter), the inside bar is considered significant.
Zone Drawing:
For each detected inside bar, the indicator draws a rectangular zone bounded by the parent candle’s high and low. This zone automatically extends to the right as new bars appear until the price moves outside the parent candle’s range.
Zone Completion:
Once the price closes above the parent candle’s high or below its low, the zone is considered complete and stops extending.
Visual Aids:
If enabled, the indicator can shade the background of the current inside bar for additional visual emphasis.
A label with the text "IB" appears above the inside bar candle on the chart for easier identification.
Alerts:
Supports alerts when a new inside bar forms.
Alerts help traders notice important signals promptly.
To activate, create an alert on the indicator with the condition “New Inside Bar”.
Benefits of the Indicator:
Inside bars often signal consolidation and potential liquidity accumulation, which may be followed by a strong impulsive breakout. This indicator helps traders quickly identify consolidation zones and prepare for possible price moves.
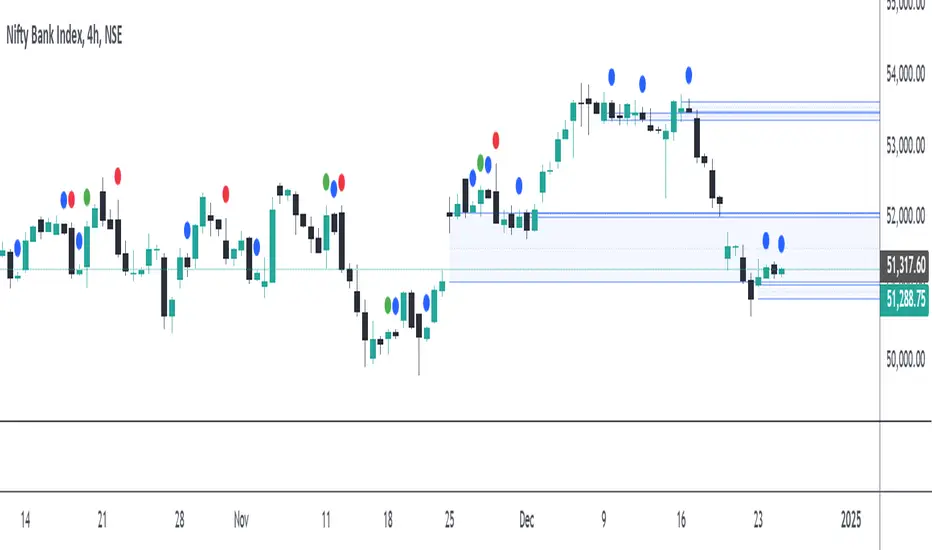
Engulfing Patterns & Inside Bar at NWOGEngulfing Patterns & Inside Bar at NWOG:
This indicator is designed to detect and display specific candlestick patterns (Bearish Engulfing, Bullish Engulfing, and Inside Bar) when they occur at the New Week Open Gap (NWOG). The indicator provides tiny dots plotted at the top of the candle for each detected pattern, keeping the chart clean and minimal. Below is a detailed description of the logic and components:
Candlestick Patterns Detected:
Bearish Engulfing:
A Bearish Engulfing pattern occurs when:
The current candle’s high is above the previous candle’s high.
The current candle’s close is below the previous candle’s low.
This pattern signals a potential downtrend and is marked by a red dot at the top of the candle.
Bullish Engulfing:
A Bullish Engulfing pattern occurs when:
The current candle’s low is below the previous candle’s low.
The current candle’s close is above the previous candle’s high.
This pattern signals a potential uptrend and is marked by a green dot at the top of the candle.
Inside Bar:
An Inside Bar pattern occurs when:
The current candle’s high is lower than the previous candle’s high.
The current candle’s low is higher than the previous candle’s low.
This pattern indicates a period of consolidation and possible breakout or breakdown, and is marked by a blue dot at the top of the candle.
New Week Open Gap (NWOG) Condition:
The patterns (Bearish Engulfing, Bullish Engulfing, and Inside Bar) are only considered valid if the candles occur within or touch the range of the New Week Open Gap (NWOG).
The NWOG is defined as the gap between:
The Friday close (previous week’s closing price).
The Monday open (current week’s opening price).
If the signal patterns (Bullish Engulfing, Bearish Engulfing, Inside Bar) align with the NWOG, a tiny dot is plotted at the top of the candle where the pattern occurs.
Visual Representation:
Red Dots: Indicate Bearish Engulfing signals that occur at the NWOG.
Green Dots: Indicate Bullish Engulfing signals that occur at the NWOG.
Blue Dots: Indicate Inside Bar Breakdown signals that occur at the NWOG.
Each dot is plotted as a tiny circle at the top of the candle, ensuring the chart remains minimal and clean without cluttering the view.
Key Features:
Minimal and Clean: The indicator only plots tiny dots at the top of the candles for the detected signals. No additional lines, labels, or other visual elements clutter the chart.
Customizable Signal Colors: Users can customize the colors for each signal type (Bearish Engulfing, Bullish Engulfing, and Inside Bar).
Alerts: Alerts are included for all detected patterns (Bullish Engulfing, Bearish Engulfing, Inside Bar) at the NWOG.
Alerts:
Bearish Engulfing Detected: Alerts when a Bearish Engulfing pattern occurs at the NWOG.
Bullish Engulfing Detected: Alerts when a Bullish Engulfing pattern occurs at the NWOG.
Inside Bar Breakdown Detected: Alerts when an Inside Bar Breakdown pattern occurs at the NWOG.
This indicator is helpful for traders who want to focus on clean, easy-to-spot patterns and trade based on market conditions near the New Week Open Gap (NWOG). The tiny dots ensure that only relevant signals are displayed without any distractions.
Pin Bar, Inside Bars and Engulfing Candle SticksIntroducing the Candlestick Pattern Plotter, a comprehensive TradingView indicator designed to elevate your technical analysis by automatically identifying and plotting three essential candlestick patterns – Pin Bars, Engulfing Candles, and Inside Bars. This powerful tool equips traders with a holistic view of market dynamics, enabling them to make informed decisions based on key price action signals.
Pin Bar Identification:
The indicator adeptly recognizes Pin Bars, a pivotal candlestick pattern characterized by a small body and a long wick in the opposite direction of the prevailing trend.
Pin Bars are instrumental in signaling potential trend reversals or continuations, providing crucial insights for strategic decision-making.
Engulfing Candle Detection:
Identify Engulfing Candles effortlessly with this indicator, showcasing instances where the body of one candle fully engulfs the body of the previous candle.
Engulfing Candles serve as powerful reversal indicators, offering valuable insights into shifts in market sentiment and potential trend reversals.
Inside Bar Recognition:
The indicator goes beyond traditional patterns by identifying Inside Bars, where the range of a candle is entirely within the previous candle's high and low.
Inside Bars often signify consolidation or a period of indecision in the market, providing traders with crucial information about potential breakouts or reversals.
Seamlessly integrate the Candlestick Pattern Plotter into your TradingView chart, enjoying a user-friendly interface for swift interpretation of candlestick patterns.
Toggle the display of Pin Bars, Engulfing Candles, and Inside Bars on and off with ease, allowing you to focus on the specific patterns most relevant to your analysis.
Real-Time Alerts:
Stay ahead of the market with real-time alerts that notify you when a Pin Bar, Engulfing Candle, or Inside Bar is identified on the chart.
Timely notifications keep you informed, ensuring you never miss a potential trading opportunity based on these crucial candlestick patterns.
Enhance your trading strategy with the precision of Pin Bars, Engulfing Candles, and Inside Bars, seamlessly integrated into your analysis through the Candlestick Pattern Plotter. Gain a comprehensive understanding of market movements and make well-informed decisions in real-time.
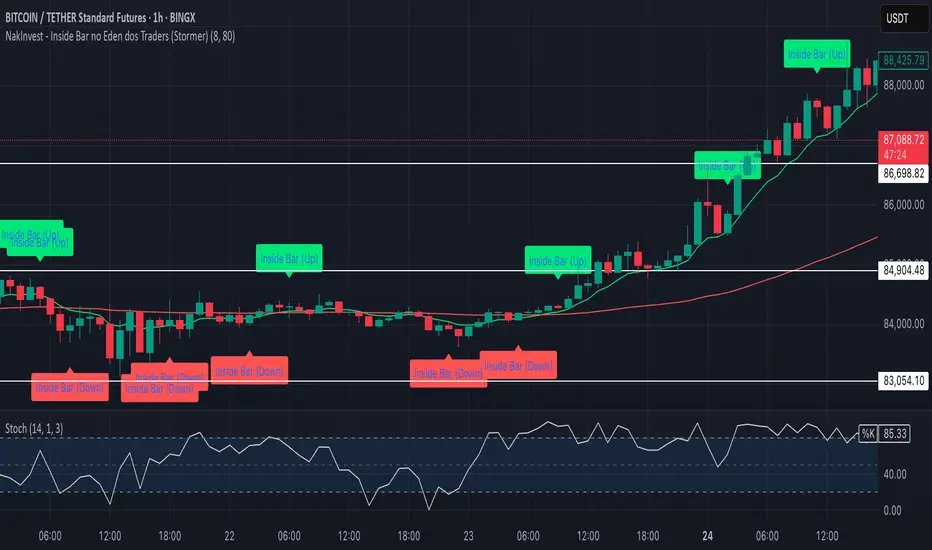
NakInvest - Inside Bar no Eden dos Traders (Stormer)📌 NakInvest - Inside Bar Detector (Éden dos Traders Enhanced Detection)
This indicator is designed to identify Inside Bars that occur during strong trending conditions, following the popular Éden dos Traders strategy by Stormer, famous brazilian trader. It uses the relationship between two EMAs (Short EMA & Long EMA) to determine whether the market is in a bullish or bearish trend, and highlights Inside Bars that meet specific criteria.
⸻
🔍 What This Indicator Does:
1. EMA-Based Trend Detection:
• Identifies Uptrends when the Short EMA is above the Long EMA.
• Identifies Downtrends when the Short EMA is below the Long EMA.
2. Inside Bar Detection:
• An Inside Bar is detected when the entire candle (body & wicks) is contained within the body of the previous candle.
• This pattern suggests consolidation and potential breakouts, especially when found within a strong trend.
3. Debug Mode for Transparency:
• When enabled, provides visual markers to indicate when the conditions for trend detection and Inside Bars are met.
• Helps traders understand why certain candles are detected and others are not.
⸻
📈 How to Use:
• Apply this indicator to any market and timeframe, but it’s most effective on higher timeframes (H1, H4, Daily).
• Ideal for traders looking for trend-continuation setups or reversal signals after periods of consolidation.
• Combine this indicator with other tools (e.g., Volume Analysis, Price Action Patterns) for greater accuracy.
⸻
⚙️ Indicator Settings:
1. Short EMA Length: The period for the fast-moving average (default: 8).
2. Long EMA Length: The period for the slow-moving average (default: 80).
3. Enable Debug Mode: Toggle visibility of debug markers to better understand condition logic.
⸻
📢 Alerts:
This script includes labels for:
• IB (Up): Inside Bar detected during an uptrend.
• IB (Down): Inside Bar detected during a downtrend.
⸻
📌 Disclaimer:
This indicator is intended for educational purposes only and is not financial advice. Always perform your own research and consult with a financial professional before making any trading decisions.
Smart Inside Bar Zones by Dinkan🔹 How It Works
An Inside Bar is formed when a candle’s high and low are completely within the previous candle’s range.
The indicator detects this structure in real time, creates a visual box around it, and extends the zone until the pattern is broken.
Inside Bar candles can be optionally highlighted with a custom color to make them stand out clearly on the chart.
🔹 Features
✅ Automatic Inside Bar detection
✅ Dynamic Inside Bar zone boxes with custom fill & border color
✅ Inside candle body highlighting with user-defined color
✅ Adjustable transparency and border style
✅ Option to display only the latest Inside Bar zone for cleaner charts
🔹 Usage
Traders can use Inside Bar zones to:
Study price compression and breakout regions
Observe range behavior and trend continuation setups
Combine with other tools like volume or support/resistance analysis
🔹 Customization
Change box fill and border color
Adjust Inside Candle color for better visibility
Set transparency and choose whether to show all or only the latest box
⚠️ Disclaimer
This script is intended for market structure visualization and educational purposes only.
It does not generate trading signals or financial advice.
Always perform your own analysis and risk management before making trading decisions.

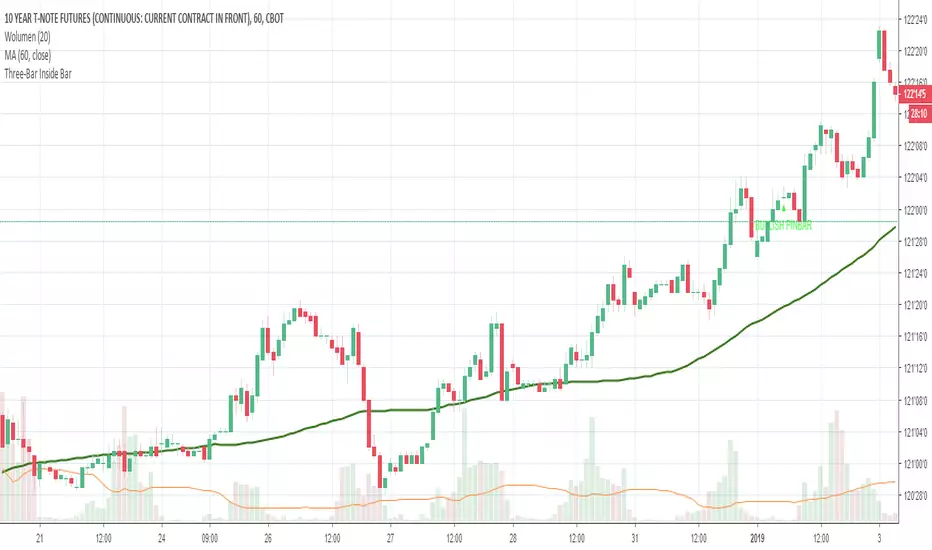
Three-Bar Inside Bar PaternAuthor: Johnan Prathap TASC March 2011
The typical inside bar two-bar view indicates minimal activity in a market. It is defined as a bar (or series of bars) that is completely within the range of the preceding bar; that is, it has a higher low and lower high than the bar immediately before it. Some traders consider a bar an inside bar if the high and low are equal to the previous bar or where there are several consecutive bars within the range of a previous bar.
Many analysts tend to view inside bars as an indication of declining market activity, or possibly a prelude to a large movement in either direction.
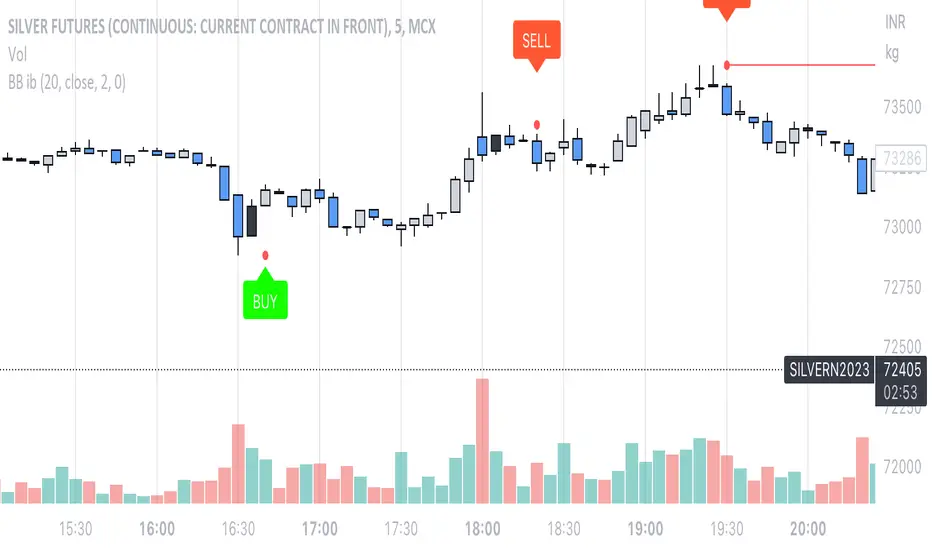
Bollinger Bands Inside barthe indicator name is Bollinger Band inside bar because it uses Bollinger Band and inside bar to take counter-trend positions in the market. whenever this pattern is formed then it can be used to take an entry into the market. the candlestick pattern recognizes 3 candle candlestick. first the mother bar i.e. the medium to the big size candle that intersects with the upper and the lower levels of the Bollinger band. the second candle should be an inside bar i.e. the high and low of the current bar should be less than the previous bar. finally, the last bar who's low should be less than the mother bar in case of the mother bar is at upper levels and if the mother bar is at lower levels then the candle's high should be more than the mother bar. the stop-loss should be high and low of the mother bar respectively. entry should be taken as soon as the low and high of the mother bar is taken out respectively. target should be 1:1 or 20 sma or lower Bollinger band in case the entry is taken from the top. works best if there is a trend and the market takes a pullback and this pattern is formed.